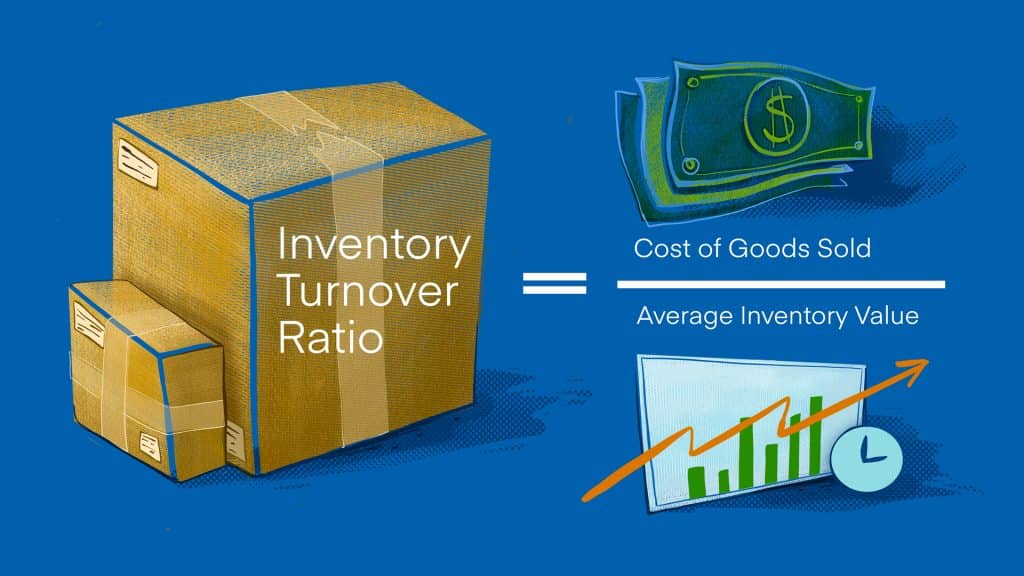
Inventory Turnover Ratio (ITR) is one of the most crucial metrics for evaluating the effectiveness of your ecommerce business. The formula is simple:
INVENTORY TURNOVER = Cost of Goods Sold (COGS) / Average Inventory Value
For a given period, you divide your total cost of goods sold (COGS) by the average inventory value over that same period. Descartes Sellercloud’s robust reporting features make it easy to find these values (as well as inventory turnover), but they are also fairly simple to identify using your own ecommerce business data.
COGS are a time-based metric. They can be calculated over a period of time by adding the beginning inventory costs, adding the additional inventory costs (labor, parts, storage, etc.), and then subtracting the ending inventory value. To find the corresponding average inventory value, total your beginning and ending inventory values for the same period as your COGS calculation and divide that sum in half.
This ratio of the COGS and average inventory value over time can tell you a lot about the efficiency of your ecommerce business and generate key benchmarks for assessing your purchasing and sales performances.
Interpreting Your Inventory Turnover
Inventory turnover is a ‘sweet spot’ metric. If it is too high or too low, you likely have an issue. A low ITR is the most obvious problem. As your inventory turnover approaches zero, it indicates that your stock isn’t moving sufficiently to justify its cost. This could be due to several reasons: overstocking, dead stock, poor marketing, and/or a lack of a diversified marketplace strategy.
A low ITR won’t pinpoint the problem for you, but it should act as the red warning light that it is time to diagnose the issue(s). Conversely, a high ITR indicates that you are moving through inventory quickly. In most cases, this is a positive, but if your inventory turnover is too high, you may miss out on sales opportunities due to low inventory levels and an inability to meet buyer demand. You never want to have to turn a potential customer away with an out-of-stock status message.
So, where is the inventory turnover ‘sweet spot ‘? Most experts recommend an ITR between 5 and 10 as the ideal. This is more of a guideline than a hard-and-fast rule. To determine the best ITR for your ecommerce business, consider your industry, customer profile, and specific business model. For example, if you deal in perishables or high-holding cost inventory, you want your turnover ratio to skew higher (since longer holding times equal higher costs).
On the other hand, if you deal in luxury or niche products with lower holding costs, skewing lower may be best. In general terms, as long as the product of your inventory turnover rate and gross profit margin percentage is less than 1, your average inventory value is not too high. Paying attention to the relationship between your ITR and overall profit-loss values should help you achieve optimal inventory turnover conditions.

Other Inventory Value Metrics
Along with inventory turnover, there are other key data points you should be actively monitoring to maximize the efficiency of your ecommerce business. Descartes Sellercloud’s Inventory Value Dashboard gives you access to a host of other graphs and data points about your inventory, including:
Inventory Value
This is your current total inventory value. It includes everything your company currently holds—available and reserved, both sellable and unsellable. This provides useful insight into your stock’s valuation, but more importantly, it provides a useful starting point for further analysis.
Average Inventory Value
This is the mean inventory value for a selected date range. It is calculated by totaling the inventory values for each day and dividing that sum by the number of days. In many cases, the average inventory value (referred to as total value in Descartes Sellercloud’s Inventory Value Dashboard) is more useful than the inventory value because it can balance out steep, single-day drops or spikes that may occur. This is why the average inventory value is typically used in calculating inventory turnover.
Reserved Quantity Value
This shows the average value of your reserved inventory, which includes merchandise and unshipped orders that are technically still on hand but are no longer available for sale. This is similar to On Order Value, which shows the actual value of items in an approved but unreceived purchase order (PO). These metrics allow you to isolate inventory and revenue that has not yet been fully transacted.
Top Products By Inventory Value
This surfaces your products with the highest costs. These products represent your largest inventory investments, and thus, their turnover has the most profound effect on your bottom line.
Descartes Sellercloud’s Inventory Value Reports
Descartes Sellercloud also features several inventory value reports that can be generated to drill even deeper into your inventory specifics:
Inventory by Warehouse data allows you to isolate inventory value metrics based on their physical location. This can help you adjust which inventory is stored where and identify potential logistics optimization opportunities.
Inventory by Product data provides a hyper-focused look at particular SKUs and their performance. These metrics are the basis for calculations like COGS and inventory turnover at the product level. Staying tuned in to these figures (particularly for your highest-cost products) can help you decide about details like stock reordering rates and product marketing. For example, paying attention to factors like Product Age and Unsold Inventory can help you identify your high- and low-performing SKUs and adjust accordingly.
Data-driven decision-making is crucial to ecommerce success. The Descartes Sellercloud omnichannel ecommerce growth platform is designed to help you access and use your inventory metrics to optimize your selling experiences and increase profits.
Contact us directly for a free demo of the insights and logistical optimizations we can provide for your ecommerce business.


